matplotlibの線の色、線種、線幅の指定方法を記しておく。
線の色はplot上で、青なら"b"、緑なら"g"のように指定する。ここでは、白い線を見せるために背景を灰色にしている。
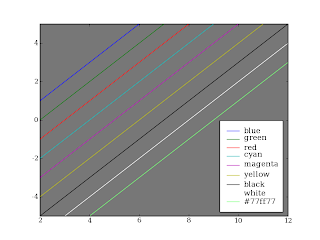
以下、図の作成に使ったソースコード。
from pylab import * axes(axisbg="#777777") # 背景を灰色に. x = arange(-20, 20, 0.3) plot(x+1, x, "b") # 青. plot(x+2, x, "g") # 緑. plot(x+3, x, "r") # 赤. plot(x+4, x, "c") # シアン. plot(x+5, x, "m") # マゼンタ. plot(x+6, x, "y") # 黄. plot(x+7, x, "k") # 黒. plot(x+8, x, "w") # 白. plot(x+9, x, color="#77ff77") # エメラルドグリーン. legend(["blue", "green", "red", "cyan", "magenta", "yellow", "black", "white", "#77ff77"], "lower right") xlim(2, 12) ylim(-5, 5) show()
次に、線種の指定方法を示す。
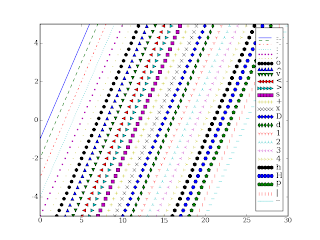
以下、ソースコード。
from pylab import * x = arange(-20, 20, 0.3) plot(x+1, x, "-") plot(x+2, x, "--") plot(x+3, x, "-.") plot(x+4, x, ":") plot(x+5, x, ".") plot(x+6, x, ",") plot(x+7, x, "o") plot(x+8, x, "^") plot(x+9, x, "v") plot(x+10, x, "<") plot(x+11, x, ">") plot(x+12, x, "s") plot(x+13, x, "+") plot(x+14, x, "x") plot(x+15, x, "D") plot(x+16, x, "d") plot(x+17, x, "1") plot(x+18, x, "2") plot(x+19, x, "3") plot(x+20, x, "4") plot(x+21, x, "h") plot(x+22, x, "H") plot(x+23, x, "p") plot(x+24, x, "|") plot(x+25, x, "_") legend(["-", "--", "-.", ":", ".", ",", "o", "^", "v", "<", ">", "s", "+", "x", "D", "d", "1", "2", "3", "4", "h", "H", "p", "|", "_"], numpoints=5, pad=0.1) xlim(0, 30) ylim(-5, 5) show()
線の色や線種は複数を同時に指定することができる。また、線の幅も指定できる。
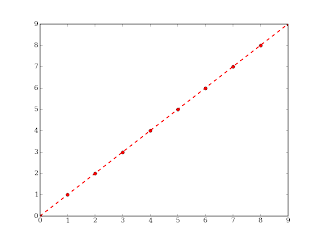
from pylab import * # linewidth の代わりに lw と書くこともできる. plot(arange(0, 10), "r--o", linewidth=2) show()
コメント